

Water-electrolysis thermodynamics
The overall liquid-phase water-electrolysis reaction is given by:
$$\:\begin{array}{cccc}&\:{\text{H}}_{2}\text{O}\left(\text{l}\right)\to\:{\text{H}}_{2}\left(\text{g}\right)+\frac{1}{2}{\text{O}}_{2}\left(\text{g}\right)&\:&\end{array}$$
(1)
Under standard-state conditions (T° = 298 K and P° = 1 bar), the corresponding thermodynamic properties are ΔH° = +285.84 kJ·mol⁻¹, ΔS° = +163.15 J·mol⁻¹·K⁻¹, and ΔG° = +237.22 kJ·mol⁻¹9. The reversible and thermoneutral cell voltages are therefore expressed as:
$$\:\begin{array}{cccc}&\:{V}_{rev}=\frac{{\Delta\:}{G}^{\circ\:}}{zF}=1.229\:\text{V}&\:&\:\end{array}$$
(2)
$$\:\begin{array}{cccc}&\:{V}_{tn}=\frac{{\Delta\:}{H}^{\circ\:}}{zF}=1.481\:\text{V}&\:&\:\end{array}$$
(3)
where \(\:z=2\) is the number of electrons transferred per water molecule and \(\:F=\text{96,485}\:\text{C}\text{\hspace{0.17em}}\text{m}\text{o}{\text{l}}^{-1}\)is Faraday’s constant. The actual operating cell voltage includes reversible, ohmic, and activation overpotential contributions:
$$\:\begin{array}{cccc}&\:{V}_{cell}={V}_{rev}+{V}_{ohmic}+{V}_{act}&\:&\end{array}$$
(4)
Concentration overpotentials were considered negligible given the relatively low operating current density employed in this study.
Climate-based design-point humidity
The design-point relative humidity was determined using the NASA POWER MERRA-2 reanalysis dataset for Cairo, Egypt (30.06°N, 31.22°E) at a reference height of 2 m32. The minimum monthly mean relative humidity occurred in May of both years, recording values of 36.69% in 2021 and 39.69% in 2022. Accordingly, the design relative humidity was defined as the arithmetic mean of these two minima:
$$\:\begin{array}{cccc}&\:R{H}_{design}=\frac{36.69+39.69}{2}=38.19\text{\%}&\:&\:\end{array}$$
(5)
This worst-case design condition is anticipated to prevail only during the most environmentally demanding 2–3 months of a typical operating year (Figs. 1 and 2). Based on the H₂SO₄–H₂O vapour-pressure isotherm at 25 °C13, a relative humidity of 38.19% corresponds to an equilibrium sulfuric acid concentration of \(\:{X}_{eq}^{*}=49.305\:\text{w}\text{t}\text{\%}\), as determined by linear interpolation of tabulated equilibrium data. An initial electrolyte concentration of 60 wt% H₂SO₄ was selected to sustain a sufficiently strong hygroscopic moisture-absorption driving force throughout the entire operating range.
Because the design condition is derived from a two-year MERRA-2 record (2021–2022), a sensitivity assessment was performed across the inter-annual minimum-humidity range of 37–43% observed over the extended 2021–2025 series (Fig. 2). Within this band, the adopted value of RH = 38.19% lies near the lower (most demanding) bound; the corresponding equilibrium concentration and required sponge area vary by less than approximately ± 8% across the range, confirming that the sizing outcome is robust to the limited observation window. Extension to a 5–10 year reanalysis record is on the other hand recommended to further improve the statistical robustness of the worst-case design definition, and is noted among the study limitations (Sect. 9.3).
To ensure realistic system design and performance evaluation, site-specific climatic data were incorporated into the analysis. The selected location is El Dabaa, Matrouh, Egypt, which represents a typical arid coastal environment within the MENA region. Meteorological data for the year 2022 were obtained from the NASA Prediction of Worldwide Energy Resources (POWER) database as shown in Fig. 6, including temperature, relative humidity, and wind speed parameters.
Based on this worst-case scenario, the required condensate production rate and system operating parameters were defined to maintain continuous hydrogen generation. The system is designed to produce 120 kg of hydrogen per day, corresponding to a water demand of approximately 1 m³ per day under continuous 24-hour operation.
This climate-driven design approach enables a realistic assessment of system feasibility and distinguishes the present work from conventional studies that assume ideal or constant environmental conditions.

Climatic conditions and design parameters for El Dabaa, Egypt, based on NASA POWER data (2022), highlighting the variation in relative humidity and its role in defining the system worst-case operating condition.
DAE Module Sizing
Mass and Molar Flow Rates
The DAE stack was dimensioned to achieve a target hydrogen volumetric flow rate of \(\:{\dot{V}}_{{H}_{2}}=0.5\:\text{L}\text{\hspace{0.17em}}{\text{h}}^{-1}\)under standard conditions (1 atm and 25 °C). Using the ideal gas relation:
$$\:\begin{array}{cccc}&\:{\dot{n}}_{{H}_{2}}=\frac{P{\dot{V}}_{{H}_{2}}}{RT}&\:&\:\end{array}$$
(6)
where \(\:R=0.082057\:\text{L}\text{\hspace{0.17em}}\text{a}\text{t}\text{m}\text{\hspace{0.17em}}\text{m}\text{o}{\text{l}}^{-1}\text{\hspace{0.17em}}{\text{K}}^{-1}\), the hydrogen molar production rate is calculated as:
$$\:{\dot{n}}_{{H}_{2}}=\frac{\left(1\left)\right(0.5\right)}{\left(0.082057\left)\right(298\right)}=0.02046\:\text{m}\text{o}\text{l}\text{\hspace{0.17em}}{\text{h}}^{-1}$$
Based on the stoichiometry of Eq. (1), the corresponding mass flow rates are:
\(\:{\dot{m}}_{{H}_{2}O}=0.3686\:\text{g}\text{\hspace{0.17em}}{\text{h}}^{-1}\)\(\:{\dot{m}}_{{H}_{2}}=0.04125\:\text{g}\text{\hspace{0.17em}}{\text{h}}^{-1}\)\(\:{\dot{m}}_{{O}_{2}}=0.3274\:\text{g}\text{\hspace{0.17em}}{\text{h}}^{-1}\)
corresponding to the water-consumption rate, hydrogen-production rate, and oxygen co-production rate, respectively.
Concentration Driving Force and Required Sponge Area
The concentration driving force governing hygroscopic moisture uptake is determined by converting weight-fraction compositions into molar concentrations according to:
$$\:C=\frac{{X}_{wt}\text{\hspace{0.17em}}{\rho\:}_{soln}}{{M}_{{H}_{2}O}}$$
where \(\:{X}_{wt}\)is the water mass fraction, \(\:{\rho\:}_{soln}\)is the solution density (kg·m⁻³ or g·L⁻¹, consistently applied), and \(\:{M}_{{H}_{2}O}\)is the molar mass of water.
Substituting the corresponding values:
$$\:{C}_{0}=\frac{0.40\times\:1494\times\:{10}^{3}}{18.015}=\text{33,172}\:{\text{mol.m}}^{-3}\:$$
(7)
(initial condition: 60 wt% H₂SO₄).
$$\:{C}^{*}=\frac{0.5070\times\:1384\times\:{10}^{3}}{18.015}=\text{38,957}\:{\text{mol.m}}^{-3}$$
(8)
(equilibrium at RH = 38.19%).
$$\:{\Delta\:}C={C}^{*}-{C}_{0}=\text{38,957}-\text{33,172}=\text{5,785}\:{\text{mol.m}}^{-3}$$
(9)
The minimum total exposed sponge area required to sustain the target water-uptake rate via molecular diffusion into the hygroscopic electrolyte is obtained using Fick’s first law15:
$$\:{\dot{m}}_{{H}_{2}O}={M}_{{H}_{2}O}\text{\hspace{0.17em}}\widehat{k}\text{\hspace{0.17em}}{A}_{total}\text{\hspace{0.17em}}{\Delta\:}C\:\:$$
(10)
where \(\:\widehat{k}=6.6*{10}^{-8}\text{\hspace{0.17em}}\text{m/s}\) the conservative (worst-case) mass-transfer coefficient for water vapour diffusion into 60 wt% H₂SO₄ at 25 °C, calibrated using experimental water-uptake data reported by Guo et al.15.
A conservative reduction in effective absorption area on the order of 10–25% may be expected under sustained desert dust loading conditions, depending on particle size distribution and exposure duration. This estimate is derived from preliminary fouling factors observed in similar air-exposed sorbent systems operating in arid climates (e.g., El-Dabaa, Egypt; see Sect. 9 Real Case Study). Periodic surface cleaning and hydrophobic pre-filter meshes are recommended as practical mitigation measures, while quantitative characterization of dust-induced mass-transfer degradation is identified as a priority for future experimental work.
Rearranging Eq. (10) yields:
$$\:{A}_{total}=\frac{{\dot{m}}_{{H}_{2}O}}{{M}_{{H}_{2}O}\text{\hspace{0.17em}}\widehat{k}\text{\hspace{0.17em}}{\Delta\:}C}$$
Substituting numerical values gives:
$$\:{A}_{total}=\frac{1.024\times\:{10}^{-4}}{18.015\times\:6.6\times\:{10}^{-8}\times\:\text{5,785}}=149\:{\text{cm}}^{2}\:$$
(11)
The total active area is distributed across \(\:n=4\:\)identical monopolar modules. Each sponge is assumed to be a cuboid of square cross-section \(\:X\times\:X\)cm and thickness 1.5 cm. Each module exposes four lateral faces, yielding an effective area:
$$\:{A}_{module}=4\times\:\left(1.5X\right)\times\:2=12X$$
Thus, enforcing \(\:n{A}_{module}={A}_{total}\)gives:
which yields:
Therefore, each sponge has dimensions \(\:6.21\times\:6.21\times\:1.5\text{\hspace{0.17em}cm}\).
The selected sponge thickness of 1.5 cm represents an experimentally validated optimum: increasing the thickness leads to a significant rise in ohmic resistance (Sect. 6.2), whereas reducing it diminishes the electrolyte volume and shortens the replenishment interval, thereby compromising both system stability and operational autonomy.
Absorption Time to Equilibrium
The volume of 60 wt% H₂SO₄ electrolyte retained within a single sponge is assumed equal to the sponge geometric volume:
$$\:{V}_{\text{sponge}}=6.21\times\:6.21\times\:1.5=57.85\:{\text{cm}}^{3}$$
The corresponding initial and equilibrium water masses within this volume are \(\:{m}_{\text{water},0}=34.57\text{\:g}\)and \(\:{m}_{\text{water,eq}}=40.60\text{\:g}\), respectively. The maximum electrolyte replenishment interval under worst-case ambient humidity conditions is therefore estimated as:
$$\:\begin{array}{cccc}&\:{t}_{\text{absorption}}=\frac{{m}_{\text{water,eq}}-{m}_{\text{water},0}}{{\dot{m}}_{{\text{H}}_{2}\text{O}}}=\frac{40.60-34.57}{0.369}=16.4\text{\:h}&\:&\:\end{array}$$
(12)
Under more favourable humidity conditions (RH > 50%), the water uptake rate increases, leading to a proportional extension of the service interval.
DAE Voltage and Efficiency
Required Current and Electrode Sizing
The total electrical current required to sustain the target hydrogen production rate is derived from Faraday’s law of electrolysis:
$$\:\begin{array}{cccc}&\:{I}_{\text{total}}=\frac{{\dot{m}}_{{\text{H}}_{2}}\text{\hspace{0.17em}}F}{Z}=\frac{0.04125\times\:\text{96,485}}{1.008\times\:3600}=1.10\text{\:A}&\:&\end{array}$$
(13)
where \(\:F\)is the Faraday constant (96,485 C·mol⁻¹) and \(\:Z\:\)represents the electrochemical equivalent of hydrogen.
$$\:Z=\frac{{M}_{{\text{H}}_{2}}}{{n}_{e}}=\frac{2.016}{2}=1.008\:{{g\cdot\:mol}}^{-1}\cdot{\text{electron}}^{-1}$$
For a four-module stack operating in parallel, the per-module current is:
$$\:\begin{array}{cccc}&\:{I}_{\text{module}}=\frac{{I}_{\text{total}}}{4}=\frac{1.10}{4}=0.275\text{\:A}&\:&\:\end{array}$$
(14)
Assuming a steady-state current density of \(\:J=15\:{{mA\cdot\:cm}}^{-2}\), determined experimentally from polarization measurements of SS-904 L mesh electrodes in 60 wt% H₂SO₄15, the required electrochemically active electrode area per module is calculated as:
$$\:\begin{array}{cccc}&\:{A}_{\text{active}}=\frac{{I}_{\text{module}}}{J}=\frac{0.275}{0.015}=18.33\:{\text{cm}}^{2}&\:&\:\end{array}$$
(15)
Voltage Decomposition
The ohmic overpotential is evaluated from the combined electrical resistances of the electrolyte and electrode components. For a 60 wt% H₂SO₄ electrolyte with an electrical resistivity of \(\:{\rho\:}_{e}=2.68\:{\Omega\:}\cdot\:\text{cm}\), a conduction path length equal to the sponge thickness (\(\:L=1.5\text{\:cm}\)), and a cross-sectional area \(\:A={6.21}^{2}=38.6\:{\text{cm}}^{2}\), the electrolyte resistance is given by:
$$\:\begin{array}{cccc}&\:{R}_{\text{electrolyte}}={\rho\:}_{e}\frac{L}{A}=2.68\times\:\frac{1.5}{38.6}=0.104\:{\Omega\:}&\:&\:\end{array}$$
(16)
For the SS-904 L mesh electrode (resistivity \(\:\rho\:=95.2\:\mu\:{\Omega\:}\cdot\:\text{cm}\), thickness \(\:1\text{\:mm}\), and active area \(\:{A}_{\text{active}}=18.33\:{\text{cm}}^{2}\)), the electrode resistance is on the order of \(\:\sim\:{10}^{-7}\:{\Omega\:}\), and is therefore negligible compared with the electrolyte contribution. Consequently, the ohmic overpotential is approximated as:
$$\:\begin{array}{cccc}&\:{V}_{\text{ohmic}}={I}_{\text{module}}\left({R}_{\text{electrolyte}}+{R}_{\text{electrode}}\right)\approx\:0.275\times\:0.104=0.029\text{\:V}&\:&\:\end{array}$$
(17)
The activation overpotential is determined using the empirical Tafel-type correlation reported by Guo et al.13 for the H₂SO₄-based DAE system:
$$\:{V}_{\text{act}}=s\cdot\:\text{l}\text{o}\text{g}\left[\left(\frac{t}{{A}_{\text{active}}}\right){I}_{\text{module}}+1\right]\:\begin{array}{cccc}&\:=0.185\cdot\:\text{l}\text{o}\text{g}\left[\left(\frac{1.002}{18.33\times\:{10}^{-4}}\right)\times\:0.275+1\right]=0.403\text{\:V}&\:&\:\end{array}$$
(18)
The Tafel parameters adopted in the present study were derived from the platinum-mesh DAE experiments reported by Guo et al.15. Since the fabricated prototype employs SS-904 L stainless-steel electrodes, which exhibit lower catalytic activity for hydrogen evolution than platinum, the calculated activation overpotential should be interpreted as a lower-bound estimate.
Based on reported hydrogen-evolution overpotential differences between platinum and austenitic stainless steels in acidic electrolytes, the actual operating voltage of the SS-904 L configuration is anticipated to exceed the model prediction by approximately 80–140 mV under comparable current densities. This correction remains consistent with the experimentally measured operating voltage range reported in Sect. 8.
Accordingly, the present analysis is best interpreted as a bounded design estimate intended to characterize comparative system behaviour rather than to provide a precise electrochemical prediction.
Electrode-Material Correction and Reconciliation with Measured Voltage
Because the discrepancy between the platinum-calibrated model and the stainless-steel prototype is central to the interpretation of all efficiency metrics reported in this work, the correction is formalised here rather than treated qualitatively. The activation overpotential of Eq. (18) is decomposed into a platinum-referenced term and an additive material-transfer penalty:
$$\:{\mathbf{V}}_{\mathbf{a}\mathbf{c}\mathbf{t},\mathbf{S}\mathbf{S}-904\mathbf{L}}=\:{\mathbf{V}}_{\mathbf{a}\mathbf{c}\mathbf{t},\mathbf{P}\mathbf{t}}+\:{\varDelta\:\mathbf{V}}_{\mathbf{H}\mathbf{E}\mathbf{R}},\:\:\:\:\:\:\mathbf{w}\mathbf{i}\mathbf{t}\mathbf{h}\:{\varDelta\:\mathbf{V}}_{\mathbf{H}\mathbf{E}\mathbf{R}}\:=\:0.080-0.140\:\mathbf{V}$$
where ΔV_HER denotes the additional hydrogen-evolution overpotential of austenitic stainless steel relative to platinum mesh in concentrated acidic electrolyte at comparable current density. Applying this bound to the platinum-referenced value of 0.403 V yields a corrected activation overpotential of 0.483–0.543 V and a corrected module operating voltage of:
$$\:{\mathbf{V}}_{\mathbf{D}\mathbf{A}\mathbf{E},\mathbf{S}\mathbf{S}-904\mathbf{L}\:}=\:1.229\:+\:0.053\:+\:\left(0.483\:\mathbf{t}\mathbf{o}\:0.543\right)\:=\:1.766\:\mathbf{t}\mathbf{o}\:1.826\:\mathbf{V}$$
The measured steady-state prototype voltage of 1.82–1.95 V reported in Sect. 8.3 brackets the upper limit of this corrected prediction. The residual difference of approximately 0–125 mV between the corrected model and the measured range is attributable to contact resistance at the current-collector–mesh interface, incomplete and spatially non-uniform electrolyte saturation of the glass-foam matrix, and the fact that laboratory measurements were conducted at RH = 45–55% rather than at the equilibrium saturation state assumed by the model. The corrected model therefore reproduces the experimental behaviour within the expected uncertainty of a first-principles design calculation, whereas the uncorrected platinum-referenced model does not.
Two distinct sets of performance figures are consequently reported throughout this manuscript and must not be conflated. The platinum-benchmark projection (V = 1.686 V, \(\:{\eta\:}_{\text{energy}}=\:87.8\text{\%}\)) represents the performance attainable with a state-of-the-art noble-metal catalyst and defines the upper performance envelope of the DAE architecture. The SS-904 L realisable estimate (V = 1.766–1.826 V, \(\:{\eta\:}_{\text{energy}}=\:81.1-83.9\text{\%}\)) represents the performance of the low-cost, acid-compatible electrode actually employed in the prototype. All efficiency values quoted in the abstract, Sect. 3.4.3, and Sect. 6.1 refer to the platinum-benchmark projection and are explicitly labelled as such; the corresponding SS-904 L values are tabulated in Table 2 for direct comparison. This dual-basis study preserves the original design results while ensuring that the reported efficiencies are not misinterpreted as measured stainless-steel performance.
where \(\:s=0.185\text{\:V\:}\)is the Tafel slope coefficient and \(\:t=1.002\:{\text{A}}^{-1}\cdot\:{\text{m}}^{2}\:\)is an experimentally derived exchange-current parameter13.
The total operating voltage of the DAE module is therefore:
$$\:\begin{array}{cccc}&\:{V}_{\text{DAE}}={V}_{\text{rev}}+{V}_{\text{ohmic}}+{V}_{\text{act}}=1.229+0.053+0.403=1.686\text{\:V}&\:&\:\end{array}$$
(19)
The activation overpotential (0.403 V), constituting approximately 24% of the total cell voltage, represents the dominant loss mechanism. This finding indicates that electrode kinetics constitute the primary performance limitation under the prevailing operating conditions, rather than ionic conduction through the electrolyte. Accordingly, further efficiency gains are expected to be more effectively realised through targeted electrode catalyst enhancement than through modifications to electrolyte geometry or cell architecture.
Stack Power and Efficiency
The per-module and total stack power consumptions are calculated as:
$$\:{P}_{\text{module}}={I}_{\text{module}}\times\:{V}_{\text{DAE}}=0.275\times\:1.686=0.464\text{\:W}$$
$$\:{P}_{\text{stack}}=4\times\:{P}_{\text{module}}=4\times\:0.464=1.856\text{\:W}$$
Two complementary performance metrics are employed to evaluate the electrochemical efficiency of the DAE system. The voltage-based energy efficiency is defined as:
$$\:\begin{array}{cccc}&\:{\eta\:}_{\text{energy}}=\frac{{V}_{\text{tn}}}{{V}_{\text{DAE}}}=\frac{1.481}{1.686}=87.8\text{\%}&\:&\:\end{array}$$
(20)
where \(\:{V}_{\text{tn}}\)is the thermoneutral voltage of water electrolysis. In addition, the electrical utilization efficiency is expressed as:
$$\:\begin{array}{cccc}&\:{\eta\:}_{\text{elec}}=\frac{{P}_{\text{stack}}-{I}_{\text{total}}{V}_{\text{ohmic}}}{{P}_{\text{stack}}}=\frac{1.856-(1.10\times\:0.053)}{1.856}=97.3\text{\%}&\:&\:\end{array}$$
(21)
It is important to emphasise that the energy efficiency (87.8%) and electrical utilisation efficiency (97.3%) reported for the DAE configuration are cell-level metrics evaluated on a voltage basis and an ohmic-loss basis, respectively, and do not incorporate balance-of-plant auxiliary loads such as sensing, control, and safety actuation systems. When these auxiliary electrical loads are included, the aggregate DAE system efficiency is estimated at approximately 84–86%, compared with 68.5% for the DH-AE configuration. The voltage-based efficiency of 87.8% is therefore not directly comparable to higher-heating-value (HHV)-based efficiencies conventionally reported for alkaline electrolyzers without explicit normalisation to a common thermodynamic reference basis.
The overall temperature control and safety mechanism of the electrolyzer system is illustrated in Fig. 7, highlighting the integration of voltage regulation, real-time temperature monitoring, Arduino-based control, and an alarm feedback loop to ensure safe and efficient operation.
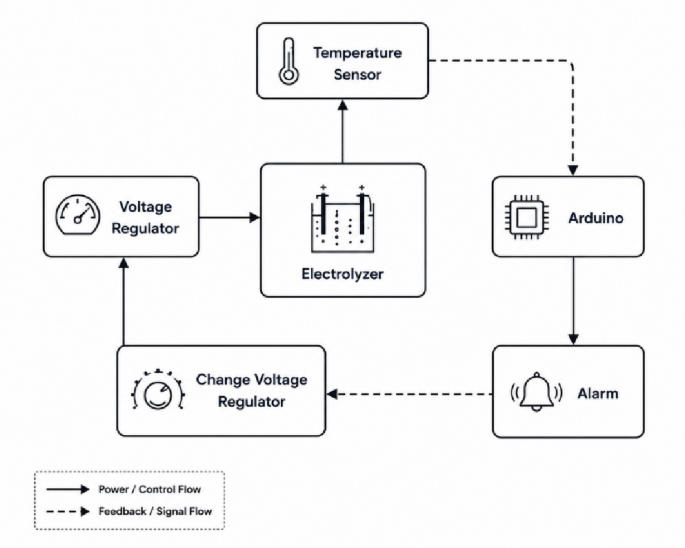
Temperature control and safety block diagram of the electrolyzer system with Arduino-based monitoring and control.
To maintain a clear distinction between the idealized electrochemical ceiling and the realistic performance of the fabricated device, Table 2 summarizes the key performance indicators on a dual basis: the platinum-benchmark projection (Sect. 3.4.2), the SS-904 L-corrected estimate (Sect. 3.4.3), and the experimentally measured prototype range (Sect. 8.3). The measured module voltage of 1.82–1.95 V falls slightly above the corrected band of 1.766–1.826 V; the residual difference of approximately 50–120 mV is attributable to contact resistance and non-uniform electrolyte distribution within the sponge matrix, rather than to a failure of the electrochemical model. Consequently, the SS-904 L-corrected energy efficiency of 81.1–83.9% represents the realistic design target for the present stainless-steel hardware, while the platinum benchmark of 87.8% defines the upper performance ceiling that could be approached through catalyst enhancement (e.g., platinum-group metal coatings or advanced HER catalysts). The electrical utilisation efficiency remains essentially unchanged across the three bases because the ohmic loss term is dominated by the electrolyte resistance, which is independent of electrode catalytic activity.
The electrical utilisation efficiency \(\:{\eta\:}_{\text{elec}}\) is comparatively insensitive to electrode material because the ohmic loss term is dominated by ionic conduction through the acid-saturated sponge and is unaffected by catalyst identity; conversely, the voltage-basis efficiency \(\:{\eta\:}_{\text{energy}}\) shifts by approximately 4–7% points, which quantifies the value of catalytic enhancement identified in Sect. 6.1 as the highest-priority development pathway.
The parameter \(\:{\eta\:}_{\text{energy}}\)quantifies the proximity of the operating cell voltage to the thermoneutral limit, whereas \(\:{\eta\:}_{\text{elec}}\)represents the fraction of supplied electrical power effectively utilized for electrochemical conversion rather than dissipated through ohmic heating.
The high electrical utilisation efficiency is primarily attributable to the low ohmic resistance of the DAE configuration, which arises from the short ionic transport path within the acid-saturated sponge matrix and the elimination of auxiliary pumping requirements. Nevertheless, these efficiency values must be interpreted within the context of the present definitions and system boundary conditions. Direct comparison with the commonly reported 65–75% higher-heating-value (HHV)-based efficiencies of conventional alkaline electrolyzers requires careful normalization of the respective efficiency formulations and balance-of-system assumptions33,34.
Figure 8 illustrates the voltage decomposition of the DAE module into reversible, ohmic, and activation components. It can be observed that the thermoneutral voltage (Vtn = 1.481 V) is exceeded primarily by the activation overpotential, indicating that the system operates close to the reversible limit.

Voltage decomposition of the DAE module with thermoneutral voltage reference (Vtn).
DH-AE system sizing
The DH-AE system is designed to produce a condensate flow rate of \(\:250\:{\text{g.h}}^{-1}\), corresponding to the water supply required to sustain a hydrogen production capacity equivalent to that of the DAE configuration. Under worst-case ambient conditions (\(\:{T}_{\text{db}}=25.13{\:}^{\circ\:}\text{C}\), \(\:{\omega\:}_{i}=5.13\:{\text{g.kg}}^{-1}\)dry air), the required dry-air mass flow rate is determined as:
$$\:\begin{array}{cccc}&\:{\dot{m}}_{\text{da}}=\frac{{\dot{m}}_{w}}{{\omega\:}_{i}-{\omega\:}_{o}}=\frac{250}{5.13}=48.73\:{\text{kg.\:h}}^{-1}&\:&\:\end{array}$$
(22)
where \(\:{\omega\:}_{i}\)and \(\:{\omega\:}_{o}\)denote the inlet and outlet humidity ratios, respectively.
The refrigeration subsystem is driven by a B38G hermetic compressor rated at 1/6 HP, delivering a cooling capacity of 297 W at a coefficient of performance (COP) of 2.87. The evaporator geometry was designed using the overall thermal-resistance approach, resulting in a configuration consisting of 58 tubes (outer diameter \(\:9.525\text{\:mm}\), inner diameter \(\:8.125\text{\:mm}\)) with a total tube length of 17.2 m, in combination with 62 aluminium fins of dimensions \(\:22\times\:4\times\:0.05\text{\:cm}\).
To enhance thermal regulation of the electrolyzer system, a finned-tube evaporator is employed as illustrated in Fig. 9.

Finned-tube evaporator used for thermal regulation of the electrolyzer system.
The condenser section comprises 22 tubes with a total tube length of 6.4 m. The performance of the alkaline electrolyzer subsystem was calibrated using the Aspen Plus model validated by Sánchez et al.35 and reported in the International Journal of Hydrogen Energy (IJHE).
Accounting for compressor power consumption, auxiliary fan demand, and pump loads, the integrated DH-AE system achieves an overall energy efficiency of 68.5%.
To provide a comprehensive comparison of the mass and energy performance between the two configurations, Table 3 summarizes the key design and operational parameters of the DAE and DH-AE architectures at their respective operating points.
Figure 10 presents the experimental setup of the integrated renewable energy-driven zero-gap alkaline electrolyzer (DAE) system. The system is powered by a hybrid renewable energy source combining wind and solar energy, connected to a power supply and control unit. The electrolyzer stack is integrated with hydrogen and oxygen separation units, circulation pumps, and gas collection tanks. Additionally, a fluid handling structure is incorporated to ensure continuous electrolyte circulation and efficient gas production and separation.

Experimental setup of the integrated renewable energy-driven zero-gap alkaline electrolyzer (DAE) system.


