
At the most fundamental level, the techno-economic feasibility of the project depends upon two critical factors: cost of renewable power and capital cost of equipment, particularly electrolyzers. Currently the production cost of green hydrogen is significantly higher than that of grey hydrogen. Grey hydrogen costs $1.5–$1.6/kg in a stable market but could soar to a range of $3–$7.5/kg due to liquefied natural gas market disruptions.
The landed cost of renewable power plays a critical role in determining the final levelized cost of green hydrogen production. As highlighted, it accounts for up to 70% of the LCOH, making it the most important variable to optimize for competitive green hydrogen production.
Landed cost of renewable power and impact of state policy
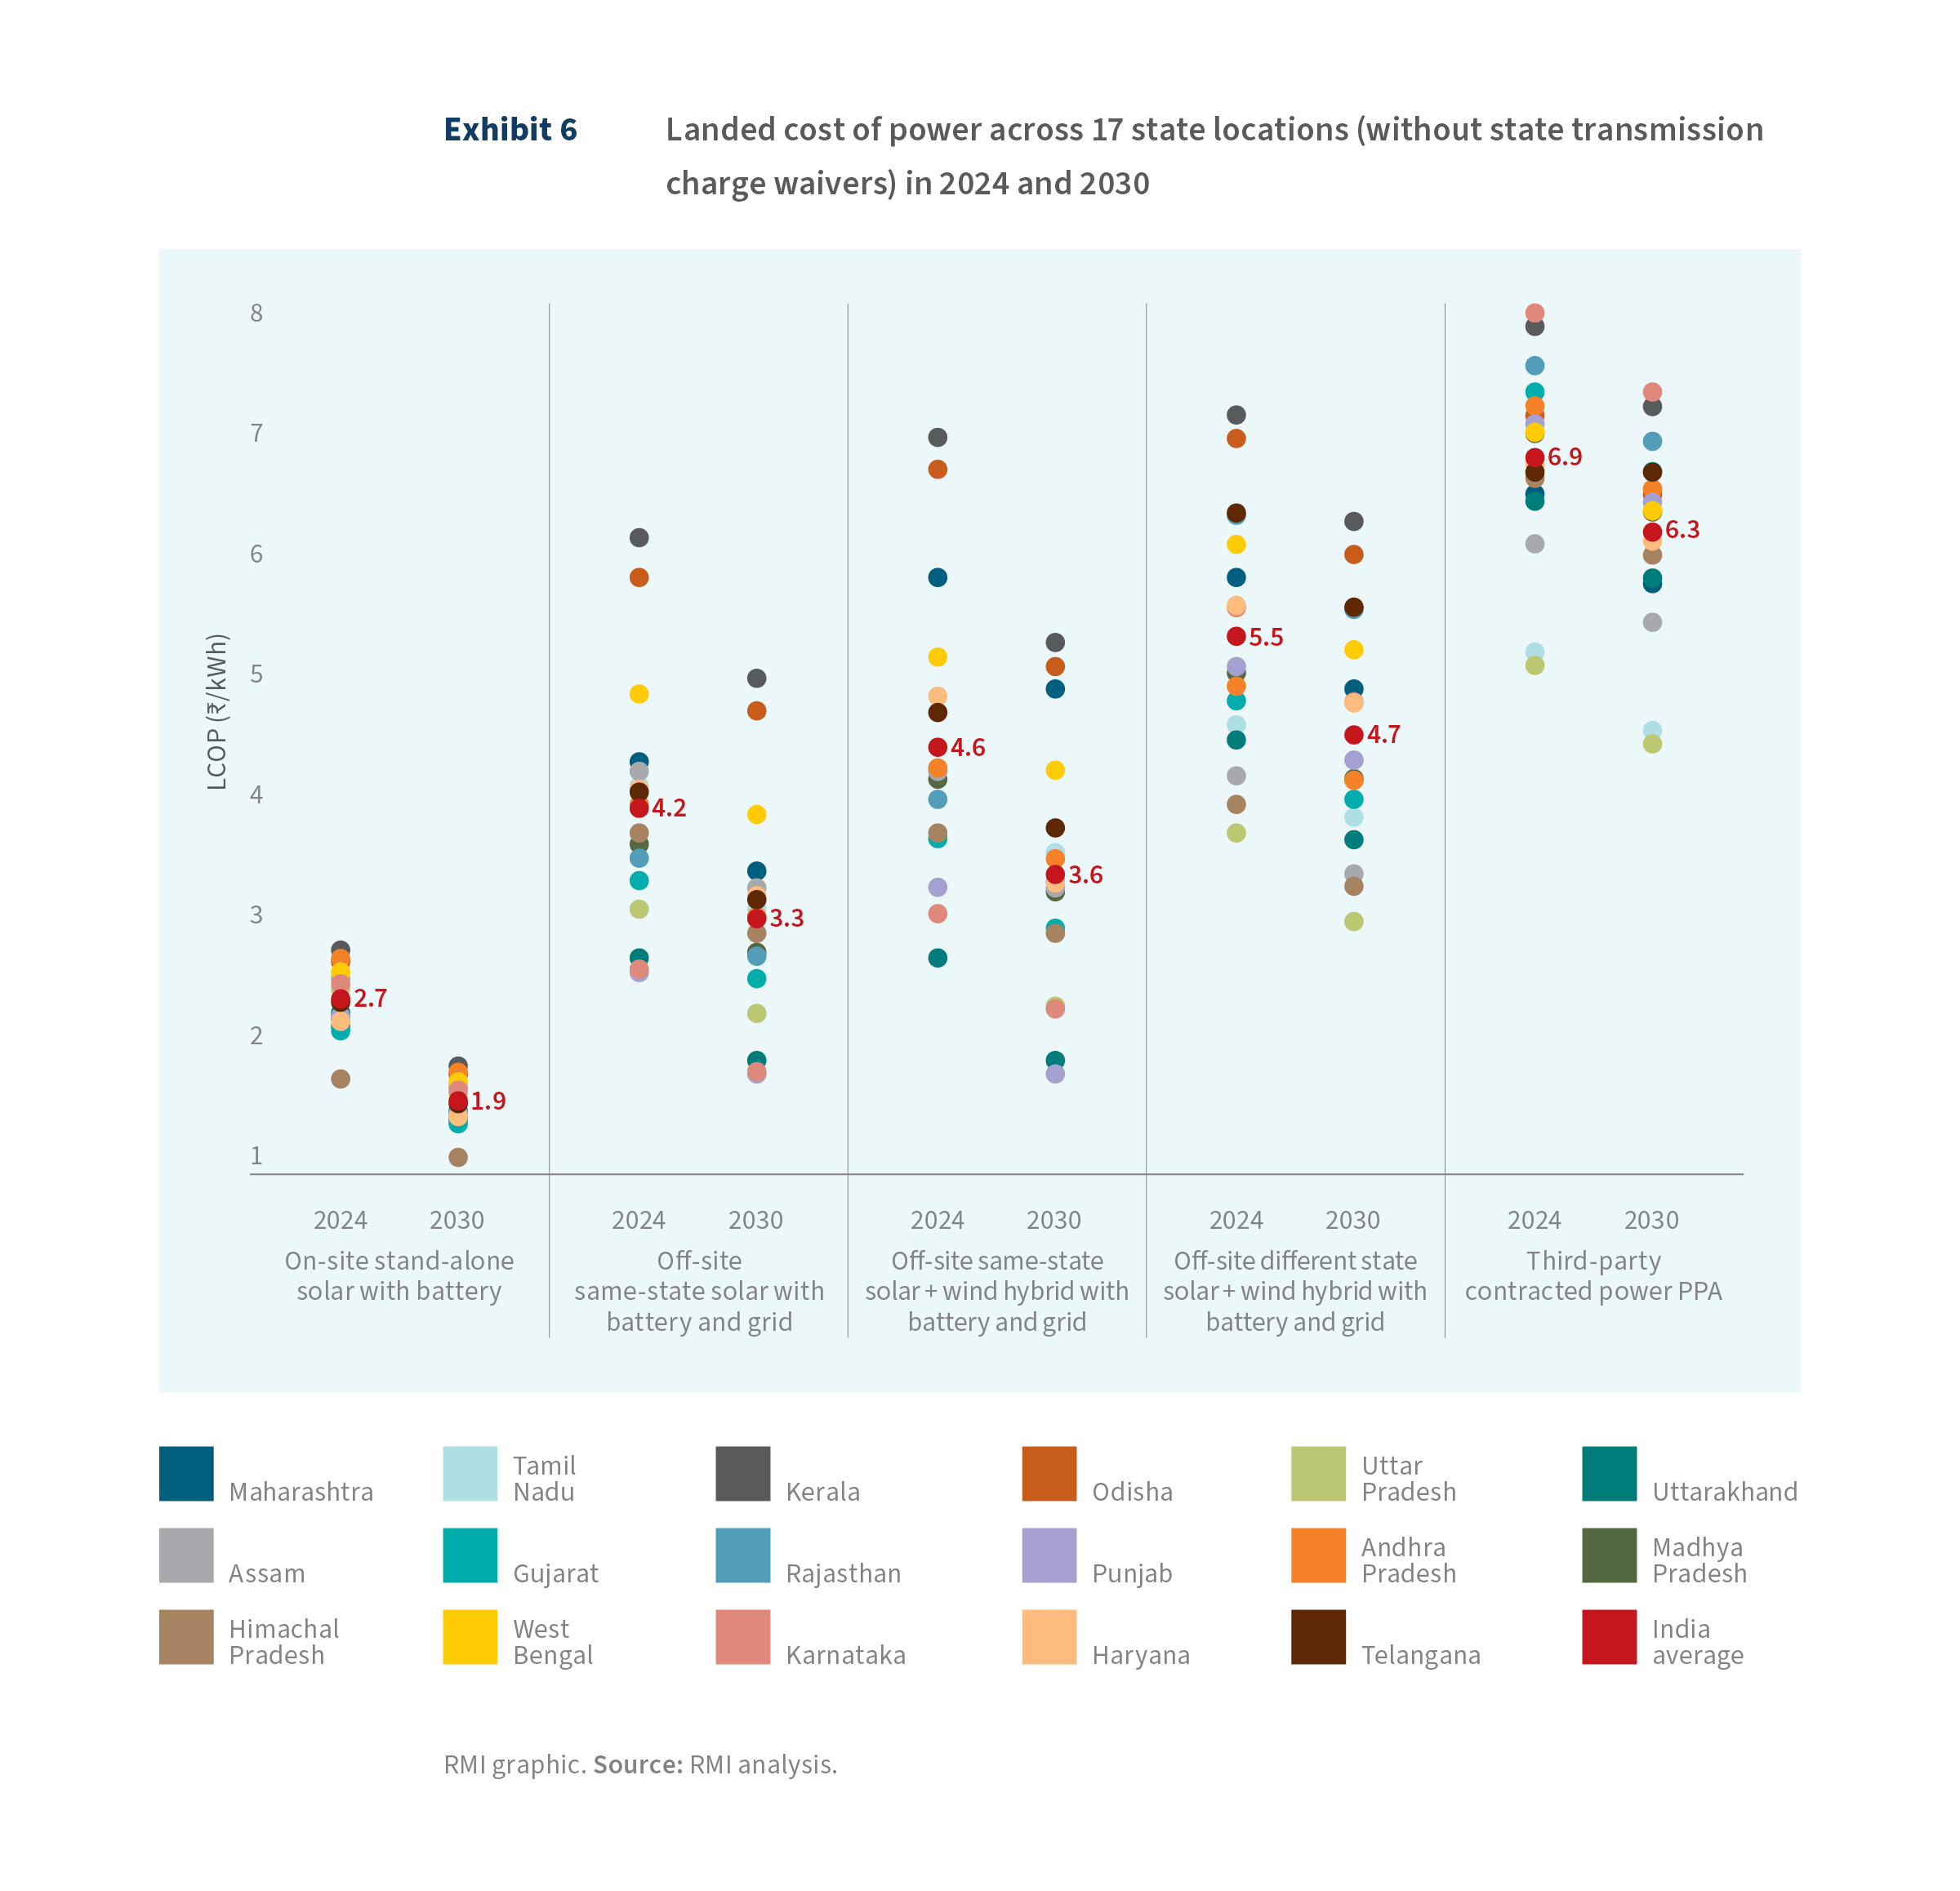
This study analyzes the landed cost of power across 17 states, as outlined in the Assessment Locations section, focusing on both on-site and off-site power generation projects. For on-site solar generation projects, where the cost of generating power is the same as the landed cost (since no transmission of electricity is involved), the current price of power can be as low as ₹2.1/kWh ($0.026/kWh). This is particularly true in renewable energy-rich regions like Gujarat, Maharashtra, and Rajasthan, which have favorable conditions for solar power generation. By 2030, due to advancements in technology, increased efficiencies, and economies of scale, this cost is expected to decrease by 30% to ₹1.5/kWh (US0.018/kWh).
In contrast, states like Andhra Pradesh, Kerala, and Odisha face higher costs for solar generation, with prices approaching ₹3.0/kWh ($0.036/kWh) due to less favorable climatic conditions, land availability issues, and less developed solar infrastructure. Across the 17 states examined, the average cost of solar power is currently around ₹2.7/kWh ($0.033/kWh), with a projected decrease to ₹1.9/kWh ($0.023/kWh) by 2030 (see Exhibit 6). This expected reduction in costs is driven by the declining price of solar panels, improved installation methods, and better grid integration for renewable energy.
For off-site projects, the situation becomes more complex due to state-imposed transmission charges. These charges, levied when power is generated in one state and transmitted to another or even within the same state, significantly increase the landed cost of power. Depending on the state and the specific project configurations, these charges can raise the landed cost by 4% to 104% — meaning considerable variability of project economics. The size of the increase largely depends on the state’s transmission infrastructure, the regulatory environment, and the nature of the power purchase agreement.
State-level transmission charges are a major contributor to the increased landed cost of green power. Across states, the share of these charges in the total landed cost ranges from 10% to 56%. States such as Gujarat, Karnataka, Tamil Nadu, and Uttar Pradesh tend to have lower transmission and wheeling charges, with the share of transmission costs being below the average of around 33% across the 17 states. On the other hand, Kerala, Maharashtra, Odisha, and Rajasthan states have higher charges, significantly increasing the overall landed cost of power in these regions.
For intra-state solar projects — where both the generation site and the green hydrogen production facility are in the same state — the price increase in the landed cost of power is relatively low, around 40% compared with stand-alone solar projects. These projects benefit from captive assets (where companies generate and use their own power) and incur only limited transmission and wheeling charges. However, when projects rely on third-party contracted power supply, the price increase can be much higher, averaging around 155% — primarily due to the higher transmission charges and fees associated with contracting power from external sources.
Additionally, projects that import power from other states — for example, solar power from Rajasthan or wind power from Tamil Nadu — face higher landed costs due to elevated transmission charges for moving power across state borders. These higher charges are often imposed because of the additional complexity and infrastructure needed to transport electricity over longer distances and significantly affect the overall cost structure for green hydrogen projects.
Third-party contracted power is significantly more expensive than captive or group captive setups due to the imposition of additional charges, such as cross-subsidy surcharges and wheeling surcharges. These charges are typically levied when power is purchased from third-party sources and transmitted across states or regions. In contrast, these surcharges are often waived for captive and group captive use cases, where companies generate and consume their own power or form a consortium to do so. This waiver makes captive setups much more economical for green hydrogen projects.
In scenarios involving third-party contracted power, the landed cost of power can increase substantially — by 80%–225%, depending on the state and the specific regulatory framework governing cross-subsidy and transmission charges. This dramatic rise in costs is especially evident in states with high regulatory fees and charges for power purchased from external sources.
However, some states present exceptions to this trend. For instance, Tamil Nadu and Uttar Pradesh impose relatively lower surcharges for third-party contracted power, making it more affordable than in other states. Additionally, states like Maharashtra have taken a progressive stance by waiving surcharges entirely for green hydrogen projects, further reducing the landed cost of power in these cases.
In states where these additional surcharges are lower or waived, the landed cost of power for green hydrogen projects can fall below the national average of ₹6.9/kWh ($0.084/kWh). This provides a competitive advantage for green hydrogen projects in these regions.
State policies offering various waivers on electricity charges reduce the landed cost of power for green hydrogen projects, from 2% to 94%, depending on the project structure and the state’s policy landscape. For off-site projects, which purchase electricity from the grid, these waivers play a crucial role in reducing both capital expenditure (capex) and operational expenditure (opex) by lowering electricity tariffs, which are one of the most significant components of hydrogen production costs.
However, for on-site projects — where power is generated directly at the project site through renewable energy sources like solar or wind — electricity waivers are not applicable since the power is not sourced from the grid. In these cases, capital subsidies become critical. These subsidies incentivize investment in renewable energy assets, enabling cost reductions through reduced up-front capital requirements. On average, capital subsidies for on-site projects can reduce power costs by about 30% (see Exhibit 7), lowering overall hydrogen production costs.
That said, not all states offer comprehensive support for on-site projects. For example, although states such as Andhra Pradesh, Punjab, and West Bengal have introduced dedicated green hydrogen policies, they do not offer capital investment subsidies for renewable energy assets. As a result, there is little to no cost reduction in power for on-site projects under these states’ policies.

In contrast, off-site projects can take advantage of both capital subsidies and electricity charge waivers. These combined subsidies can reduce the cost of power by 2%–40%, with the smallest reduction observed in Himachal Pradesh, where baseline electricity charges are already minimal. In Rajasthan, where baseline charges are higher, more substantial subsidies lead to the largest reductions. In industrialized states like Maharashtra and Uttar Pradesh, the post-subsidy cost of power is notably lower, reaching ₹2.8/kWh and ₹2.1/kWh ($0.034/kWh and $0.026/kWh), respectively.
Among all states, Odisha stands out as a leader in driving down power costs for green hydrogen production. In addition to the capital subsidies and electricity charge waivers offered under its Industrial Promotion Policy, Odisha provides an additional waiver of ₹3/kWh ($0.036/kWh) on electricity prices, a unique incentive not currently matched by any other subnational policy. This combination of subsidies leads to a remarkable reduction of power costs in Odisha, slashing them by around 50%, and when combined with the additional waiver, this reduction can reach as much as 94%.
These reductions in power costs are crucial to making green hydrogen economically competitive. Detailed discussions on the cost implications across different project configurations are provided in the following sections.
Stand-alone on-site projects
Stand-alone green hydrogen projects are typically designed to operate independently from the electrical grid, relying exclusively on on-site renewable energy sources like solar or wind, and complemented by battery storage systems, to power the electrolysis process. However, some projects may have limited grid connectivity to supplement renewable energy during periods of low generation, while still adhering to strict carbon intensity thresholds.
For example, a project could be connected to the grid as long as the associated carbon emissions do not exceed 2 kg of CO2 per kg of hydrogen produced, criteria set by the MNRE.[25] This setup allows for operational flexibility while maintaining the environmental integrity of green hydrogen production.
This project configuration stands out for its exceptional cost competitiveness compared with alternative arrangements, primarily due to the absence of transmission charges that typically affect grid-connected projects. Without transmission charges, the ongoing operational costs for the project are reduced, directly lowering the overall cost of producing green hydrogen.
Consequently, with fewer recurring charges, the project can achieve better profit margins, especially in competitive markets where small cost reductions can make a significant difference. Transmission charges can fluctuate based on grid congestion, energy demand, or regulatory changes. By avoiding the grid altogether, stand-alone projects eliminate the uncertainty and volatility associated with these charges, offering more predictable operating costs.
Stand-alone green hydrogen projects represent one of the most economical project setups, with production costs ranging from $4.4/kg of hydrogen to $4.8/kg. Projects that completely avoid using grid electricity and rely solely on battery storage tend to produce hydrogen at a lower cost than those that use grid electricity to maintain a stable base load. Although using grid electricity offers flexibility, especially in managing fluctuations in renewable energy supply, it introduces two key risks:
- Higher production costs: Incorporating grid electricity increases overall production costs, as grid electricity tariffs are relatively high across many states.
- Emissions considerations: Although these projects can still be classified as “green” due to achieving carbon intensities below 2 kg CO2/kg H2, they are not completely emissions-free. This partial reliance on fossil-fueled grid power poses challenges, particularly for export-oriented projects, where international markets may demand stricter zero-emissions credentials.
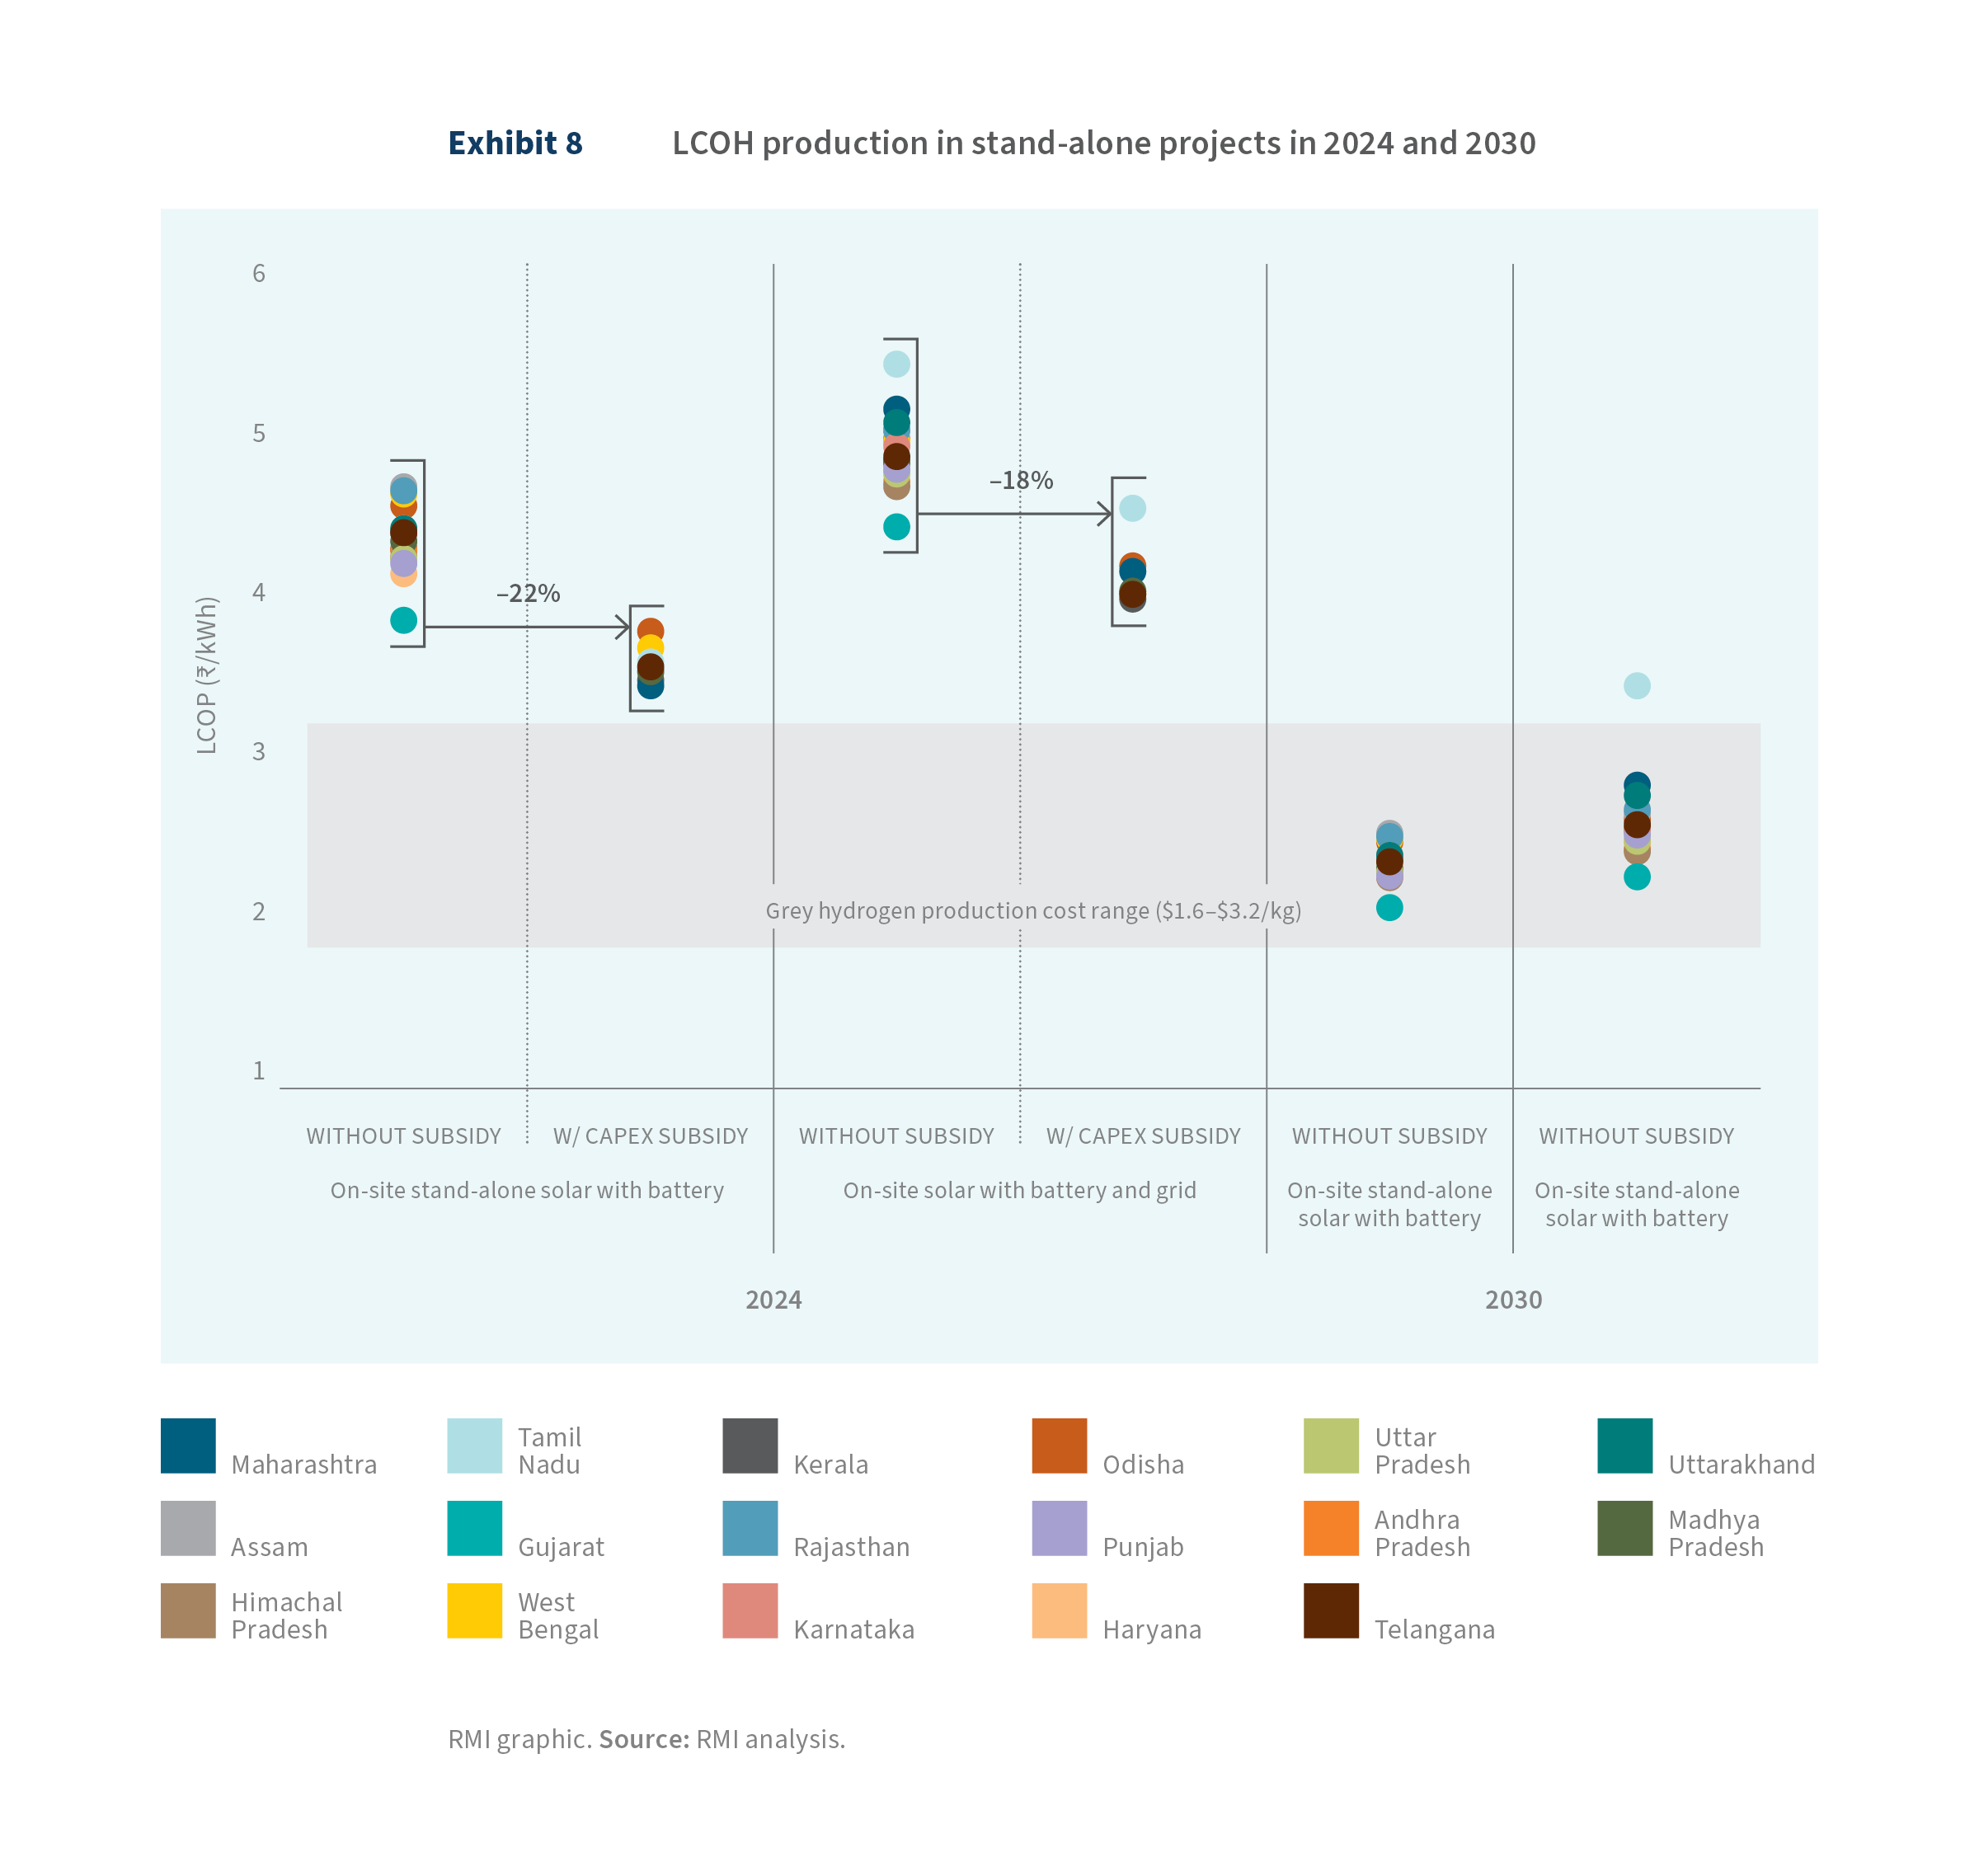
The cost of hydrogen production varies significantly across states. Andhra Pradesh, Karnataka, and Odisha face some of the highest renewable energy generation costs, which can push the hydrogen production price above $4.5/kg. In contrast, states like Gujarat, Maharashtra, and Uttarakhand offer some of the most attractive production prices, driven by more favorable renewable energy conditions.
An interesting exception is Himachal Pradesh, where hydrogen production costs are unusually low — less than $4/kg. This is primarily due to the state’s availability of more than 125 days of solar energy and a capacity utilization factor (CUF) of over 20%,[26] which contributes to its lower costs. However, despite this advantage, Himachal Pradesh is not considered a prime candidate for large-scale green hydrogen production. The challenging terrain makes it difficult to install large solar facilities, and the absence of a significant industrial consumer base in the region limits the feasibility of scaling up hydrogen production.
Although the project structure may be similar across regions, the local renewable energy potential is a significant factor in sizing green hydrogen projects. For example, in an on-site solar and battery-connected project, the optimal size of the solar component for producing 50 ktpa of green hydrogen can vary widely — from 1.9 to 2.8 GW. This range reflects regional differences in solar irradiance and resource availability, with the highest capacity required in Andhra Pradesh and one of the lowest in Gujarat.
Key industrialised states like Maharashtra, Gujarat, Tamil Nadu, Odisha, and Uttar Pradesh, all of which are positioning themselves as leading green hydrogen producers, require an average solar capacity of approximately 2.3 GW for similar projects. The sizing of electrolyzers also shows a similar variation. The required electrolyzer capacity can range from 515 to 670 MW. Battery capacity, which is essential for storing energy to manage fluctuations in renewable supply, also varies significantly. Gujarat has the lowest battery size requirement at around 280 MW, whereas Himachal Pradesh requires a battery capacity of approximately 555 MW. Additionally, the variation in green hydrogen storage requirements is considerable. For example, Karnataka has the highest storage requirement at around 916 tonnes, which is three times that needed in Kerala.
Since these projects do not incur transmission charges, owing to their on-site nature, capital subsidies from state governments become the key financial incentive to reduce overall production costs. However, not all states, even those with dedicated green hydrogen policies, offer capital subsidies. The availability of such subsidies has a significant impact on the viability and competitiveness of these projects. In states where subsidies are available, they can substantially lower capital costs, directly reducing the cost of green hydrogen production.
Several states, including Maharashtra, Uttar Pradesh, Odisha, Rajasthan, and Tamil Nadu, offer capital subsidies as part of their subnational policies to support green hydrogen projects. These subsidies typically range from 25% to 35%, with Uttar Pradesh providing the highest incentives due to an economic booster package layered on top of the capital subsidy.
On average, these capital subsidies result in a 20%–22% reduction in power costs for green hydrogen production. Although this represents a significant cost decrease, there remains a considerable gap between the cost of green hydrogen and its fossil fuel-based counterpart, grey hydrogen. This gap underscores the need for further financial and technological support to bring green hydrogen closer to cost parity with grey hydrogen.
The anticipated decline in production costs from 2024 to 2030 is even more substantial, with a projected average reduction of 46%. This decrease highlights the importance of technological advancements and economies of scale as the hydrogen sector matures. By 2030, the cost of producing green hydrogen is expected to drop from approximately $4.4/kg to $2.4/kg, driven by falling costs in renewable energy, electrolysis technology, and increased infrastructure development.
Although on-site stand-alone green hydrogen projects offer attractive cost economics by avoiding transmission costs and fully utilizing renewable energy, several critical constraints can limit their scalability and effectiveness. These constraints primarily concern the availability of land and proximity to demand centers.
Land availability
Solar and wind energy generation is land intensive. Solar power typically requires 3–5 acres per megawatt, and even more land is needed for wind energy installations due to the spacing needed between turbines. A large-scale green hydrogen facility, particularly one producing 50 ktpa, could require several thousand acres.
Not all regions have large contiguous tracts of land available for renewable projects. Additionally, land that is flat, is not prone to flooding, and has optimal solar or wind potential may be scarce. In densely populated states or regions with competing land uses (agriculture, industry, urban development), acquiring suitable land becomes even more challenging. Land acquisition can also be complicated by legal regulations, ownership disputes, and environmental considerations.
In regions where land is available, it might be prohibitively expensive, especially in proximity to industrial hubs or areas with high renewable potential. The cost of land acquisition — which is not considered in the current LCOH — can substantially increase capital expenditure, undermining the cost advantages of stand-alone projects.
Proximity to demand centers
Green hydrogen is often targeted at industrial sectors like fertilizers and refineries, which require a continuous and high-volume supply of hydrogen. Proximity to these demand centers is a critical factor for the success of on-site stand-alone projects.
If the hydrogen production site is far from industrial demand centers, the costs associated with transporting hydrogen (in either gas or liquid form) can significantly erode the economic benefits of on-site production.
Storing hydrogen for extended periods requires expensive infrastructure (such as high-pressure tanks or cryogenic storage), and the farther from demand centers, the larger the storage requirements. Additionally, distribution networks for hydrogen may need to be built to transport it from production sites to consumers, adding to capital and operational costs.
CTU-connected projects
Projects connected to the CTU or the ISTS are gaining attention from developers due to their ability to offer highly competitive production costs. This advantage primarily stems from the financial incentives and exemptions provided under the National Green Hydrogen and Ammonia Policy of 2022. Specifically, the policy waives CTU charges, enabling developers to minimize operational expenses. These cost savings translate into more favorable project economics, making CTU-connected projects particularly attractive for large-scale green hydrogen and ammonia production.
The ISTS is a network of high-voltage transmission lines that link generation centers to load centers across states. ISTS helps balance the national grid by transmitting electricity from surplus regions to deficit regions. It plays a key role in the integration of renewable energy projects, particularly large-scale solar and wind, by ensuring connectivity from remote generation sites to demand centers. ISTS facilitates the movement of electricity across states, which is crucial for interstate power trading under the open access regime. This enhances market competition and optimizes the utilization of generation assets.
Green hydrogen developers are keen to secure ISTS connectivity as they can source electricity from renewable energy plants in different states, ensuring a consistent and reliable power supply. This is especially important in regions with less favorable conditions for renewables. Additionally, green hydrogen projects can benefit from hybrid renewable energy setups, such as a combination of solar and wind, enabled by ISTS connectivity. This ensures round-the-clock energy availability, allowing hydrogen plants to operate efficiently even when one energy source (like solar) is unavailable.
Exhibit 9 highlights the LCOH production in a CTU-connected project. In this analysis, we assume that the green hydrogen production project is connected to the CTU network and is sourcing solar power from Rajasthan and wind power from Tamil Nadu. This project is connected to the grid to source renewable power. For the baseload needed to manage ramping up and down of the electrolyzer, the project can rely on the battery or purchase electricity from the grid at industrial tariffs, with the emissions constraint of 2 kg CO2/kg H2.
The production cost for green hydrogen projects connected to the ISTS can vary between $4 and $5 per kg of hydrogen, depending on the specific project components and configuration. This range reflects factors such as the inclusion of renewable energy sources (solar, wind), grid availability, and storage solutions. Projects connected to ISTS generally have more favorable economics, with costs being 20%–30% lower than those of STU-connected projects, which are often subject to multiple state-level transmission charges. These state charges can significantly inflate the cost of electricity, which is the largest operational expense in green hydrogen production.
In projects designed with a mix of grid connectivity, solar, and wind energy, battery requirements are typically limited. This is because wind and solar energy complement each other in terms of generation timing, and the grid acts as a balancing mechanism, allowing excess energy to be exported and any deficits to be met through grid power. However, in projects without access to both the grid and wind energy, batteries become essential to ensuring a steady supply of electricity, particularly when solar energy is unavailable (e.g., at night or during low-sunlight conditions). In such configurations, the share of battery-related costs (capital and operational expenditures) make up about 5% of the overall LCOH.
Similarly, in projects that have access to grid power and wind energy, hydrogen storage infrastructure is found to make up around 6% of LCOH. This is because the combination of solar, wind, and grid access ensures more continuous power generation, limiting the need for hydrogen storage to cover periods of low energy generation. In contrast, for projects relying solely on solar power, the storage component becomes critical to maintaining a consistent supply of hydrogen to consumers. In such cases, the share of storage costs rises substantially, contributing up to 20% of LCOH, as larger hydrogen storage systems are needed to bridge the gaps in solar generation.
These projects can also take advantage of capital subsidy incentives available for green hydrogen initiatives; however, these subsidies typically apply only to electrolyzers, batteries, and certain other plants and machinery. In the case of ISTS projects, where developers source renewable energy from different states, the capital subsidies provided by the state of production may not apply to the renewable energy asset. This limitation reduces the cost-saving potential that such subsidies can offer.
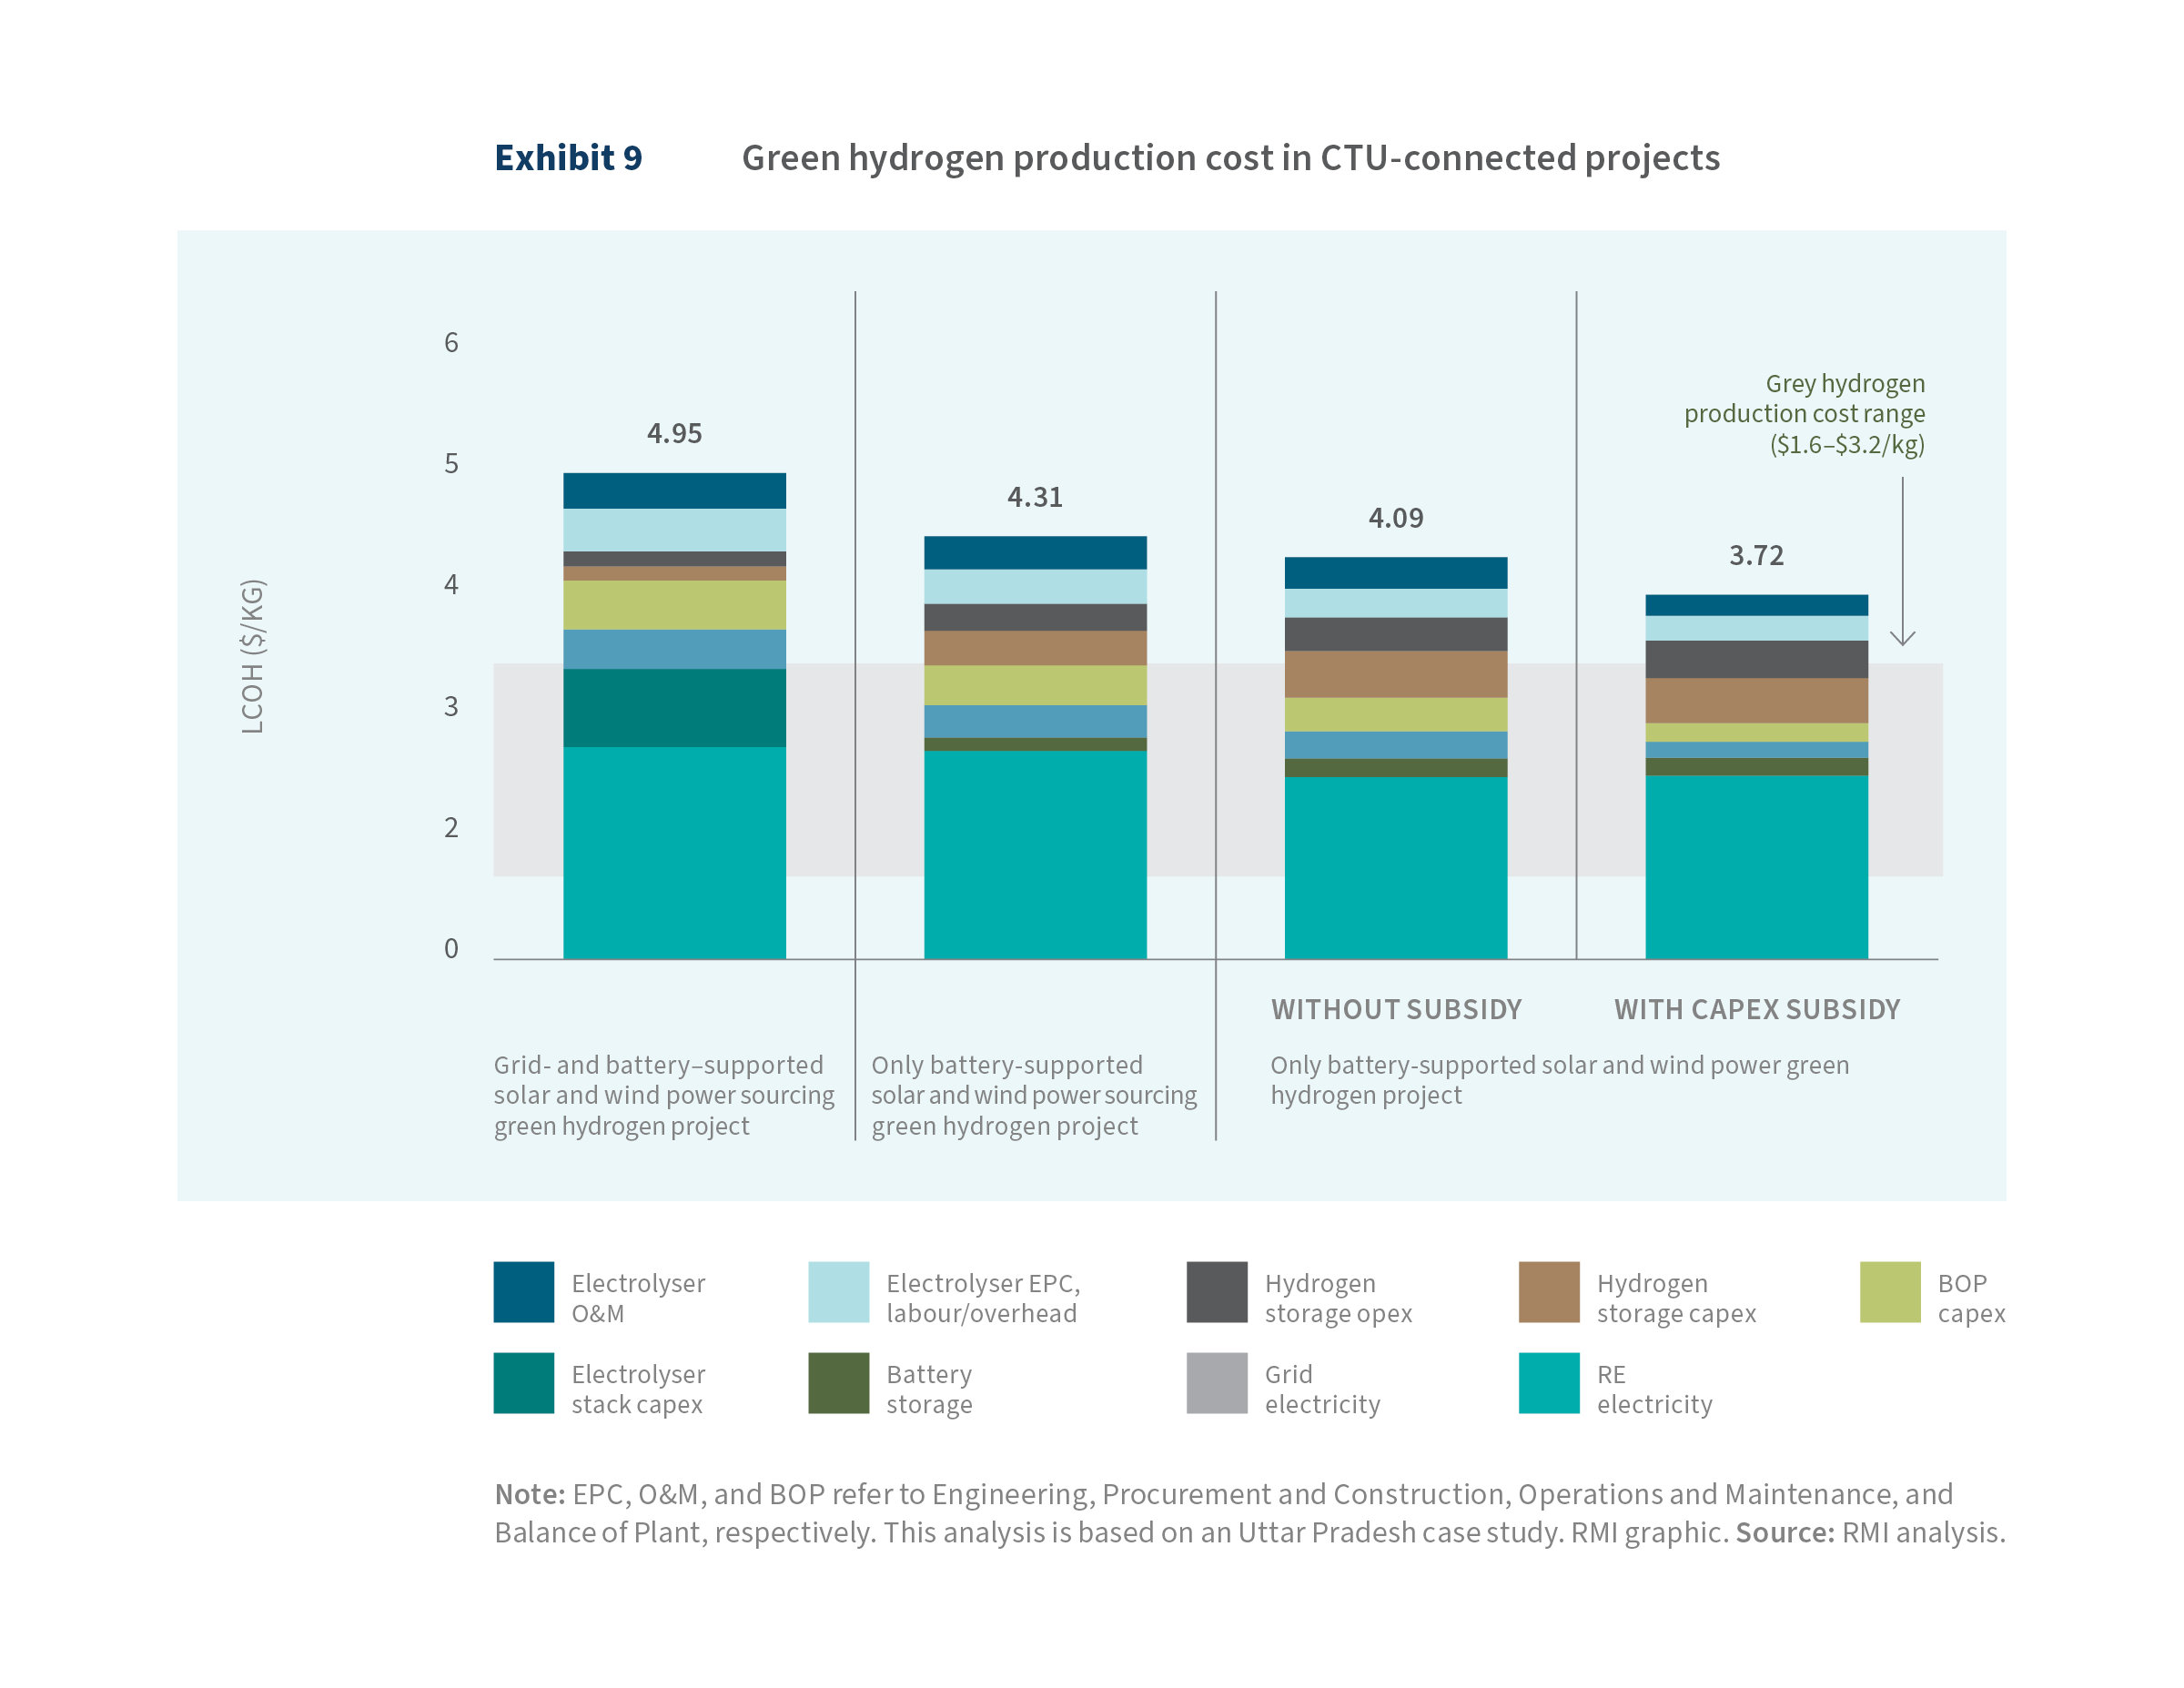
To better understand the implications, consider the example of Uttar Pradesh. With a capital subsidy of approximately 35% (including a booster), the LCOH could decrease by around 10% for a battery-supported solar project (see Exhibit 9). In this subsidized scenario, the final production cost is nearly 25% lower than that of a project using grid power in combination with batteries, solar, and wind energy.
This demonstrates that, although capital subsidies can significantly reduce production costs where they apply, their impact is less pronounced in ISTS projects due to the cross-state nature of renewable energy procurement.
ISTS connections also enable green hydrogen production units to be set up in diverse locations, including regions where renewable energy generation might not be feasible but where industries demanding hydrogen are located. The ability to transmit renewable electricity over long distances facilitates decentralized hydrogen production closer to demand centers, minimizing transport costs for hydrogen and improving its overall feasibility.
As India gears up to establish hydrogen hubs and clusters, ISTS connectivity will be essential in ensuring that these hubs are powered by renewable energy from across the country. This interconnected network helps balance supply and demand, making sure the hydrogen clusters have uninterrupted, clean electricity to meet their energy needs.
Though the ISTS connectivity can offer multiple benefits, it also comes with some key challenges that require attention from the regulatory authorities. One of them is the need for adequate transmission infrastructure. As renewable energy projects expand rapidly, particularly in remote locations with high solar and wind potential, the existing ISTS infrastructure may become insufficient. Transmission bottlenecks can delay the evacuation of renewable energy, limiting the ability of green hydrogen projects to access consistent electricity supplies.
Building new transmission lines and upgrading the ISTS infrastructure require significant investment. The capital costs associated with extending the ISTS network to remote renewable energy zones, particularly for large-scale projects like green hydrogen, can be substantial. These costs can pose financial risks, especially for developers of green hydrogen projects, as they rely on affordable electricity to remain economically viable.
Although ISTS is governed by a central regulatory framework, there are still complexities in navigating state-level regulations for renewable energy projects. Discrepancies in state policies, particularly with respect to energy banking, scheduling, and grid access, can create barriers for smooth ISTS connectivity. Additionally, policy uncertainty regarding the long-term availability of waivers or reduced transmission charges for renewable energy could affect project planning for green hydrogen developers.
Off-site (STU/DISCOM-connected) projects
As the green hydrogen ecosystem continues to mature, off-site projects that are STU- or DISCOM-connected are expected to become the most common type of green hydrogen projects. This shift will occur for several reasons, particularly due to the growing difficulty in setting up stand-alone or ISTS-connected projects in all potential demand locations.
STU/DISCOM-connected projects tap into the state’s existing transmission and distribution infrastructure, which can be more accessible and easier to integrate with the national grid or stand-alone solutions. This allows projects to be located closer to industrial or urban demand centers without the need for building new, isolated infrastructure.
Although STU-connected projects offer several advantages, they are not without challenges. The primary difficulty in prioritizing these projects lies in the higher cost of production, which is largely driven by the multiple state transmission charges, duties, and additional fees imposed when the developer is using grid infrastructure within state boundaries.
With more projects coming on line over time, it becomes increasingly difficult to find large contiguous land parcels for renewable energy generation at every demand location. State-level grid connections via STU/DISCOMs allow for the renewable energy plant to be sited in areas in the state where land and renewable resources are more abundant, while the hydrogen production facilities can remain closer to demand centers. This flexibility makes it easier to scale projects.
On average, these transmission-related charges can increase the landed cost of power to 1.5–2.5 times the base generation cost of renewable energy. The exact magnitude of these charges varies from state to state, depending on the specific regulatory framework. States with higher transmission and wheeling charges, or less favorable policies for renewable energy transmission, can make it more expensive to develop STU-connected projects. This variability creates uncertainty for developers and can complicate project planning and cost estimation.
To explore the complexities and cost implications of STU-connected projects, three different scenarios have been considered regarding the siting of renewable energy plants relative to the hydrogen production facility. The first scenario involves siting the solar plant in the same state as the green hydrogen production facility, but off site. The second scenario places off-site solar and wind plants in the same state as the hydrogen production (see Exhibit 10). The third scenario considers solar and wind plants located in different states, with solar energy sourced from Rajasthan and wind energy from Tamil Nadu in this analysis.
Whereas Kerala has the highest cost for green hydrogen production among all states — more than twice the cost of grey hydrogen — states like Gujarat, Karnataka, Punjab, Rajasthan, and Uttar Pradesh come closest to achieving costs comparable to grey hydrogen. The elevated production cost in Kerala can be attributed mainly to the higher base cost of power generation, but a significant portion is also due to substantially higher transmission charges.
When state incentives to promote green hydrogen production are evaluated, two critical factors emerge: the magnitude of the waivers (i.e., the size of the subsidies) and the tenure (how long the incentives last). These factors heavily influence the final cost of green hydrogen production. Depending on the state, the reduction in production costs due to subsidies can vary significantly, from as little as 1% in West Bengal to 61% in Odisha.
In states like Andhra Pradesh and West Bengal, the waivers for electricity charges are granted for five years, and no additional support is provided for capital investment. Green hydrogen projects typically have a life span of around 30 years, meaning that these incentives cover only one-sixth of the project’s duration. Thus, for most of the project’s life span, developers would have to bear the higher transmission charges, significantly affecting their long-term financial planning.
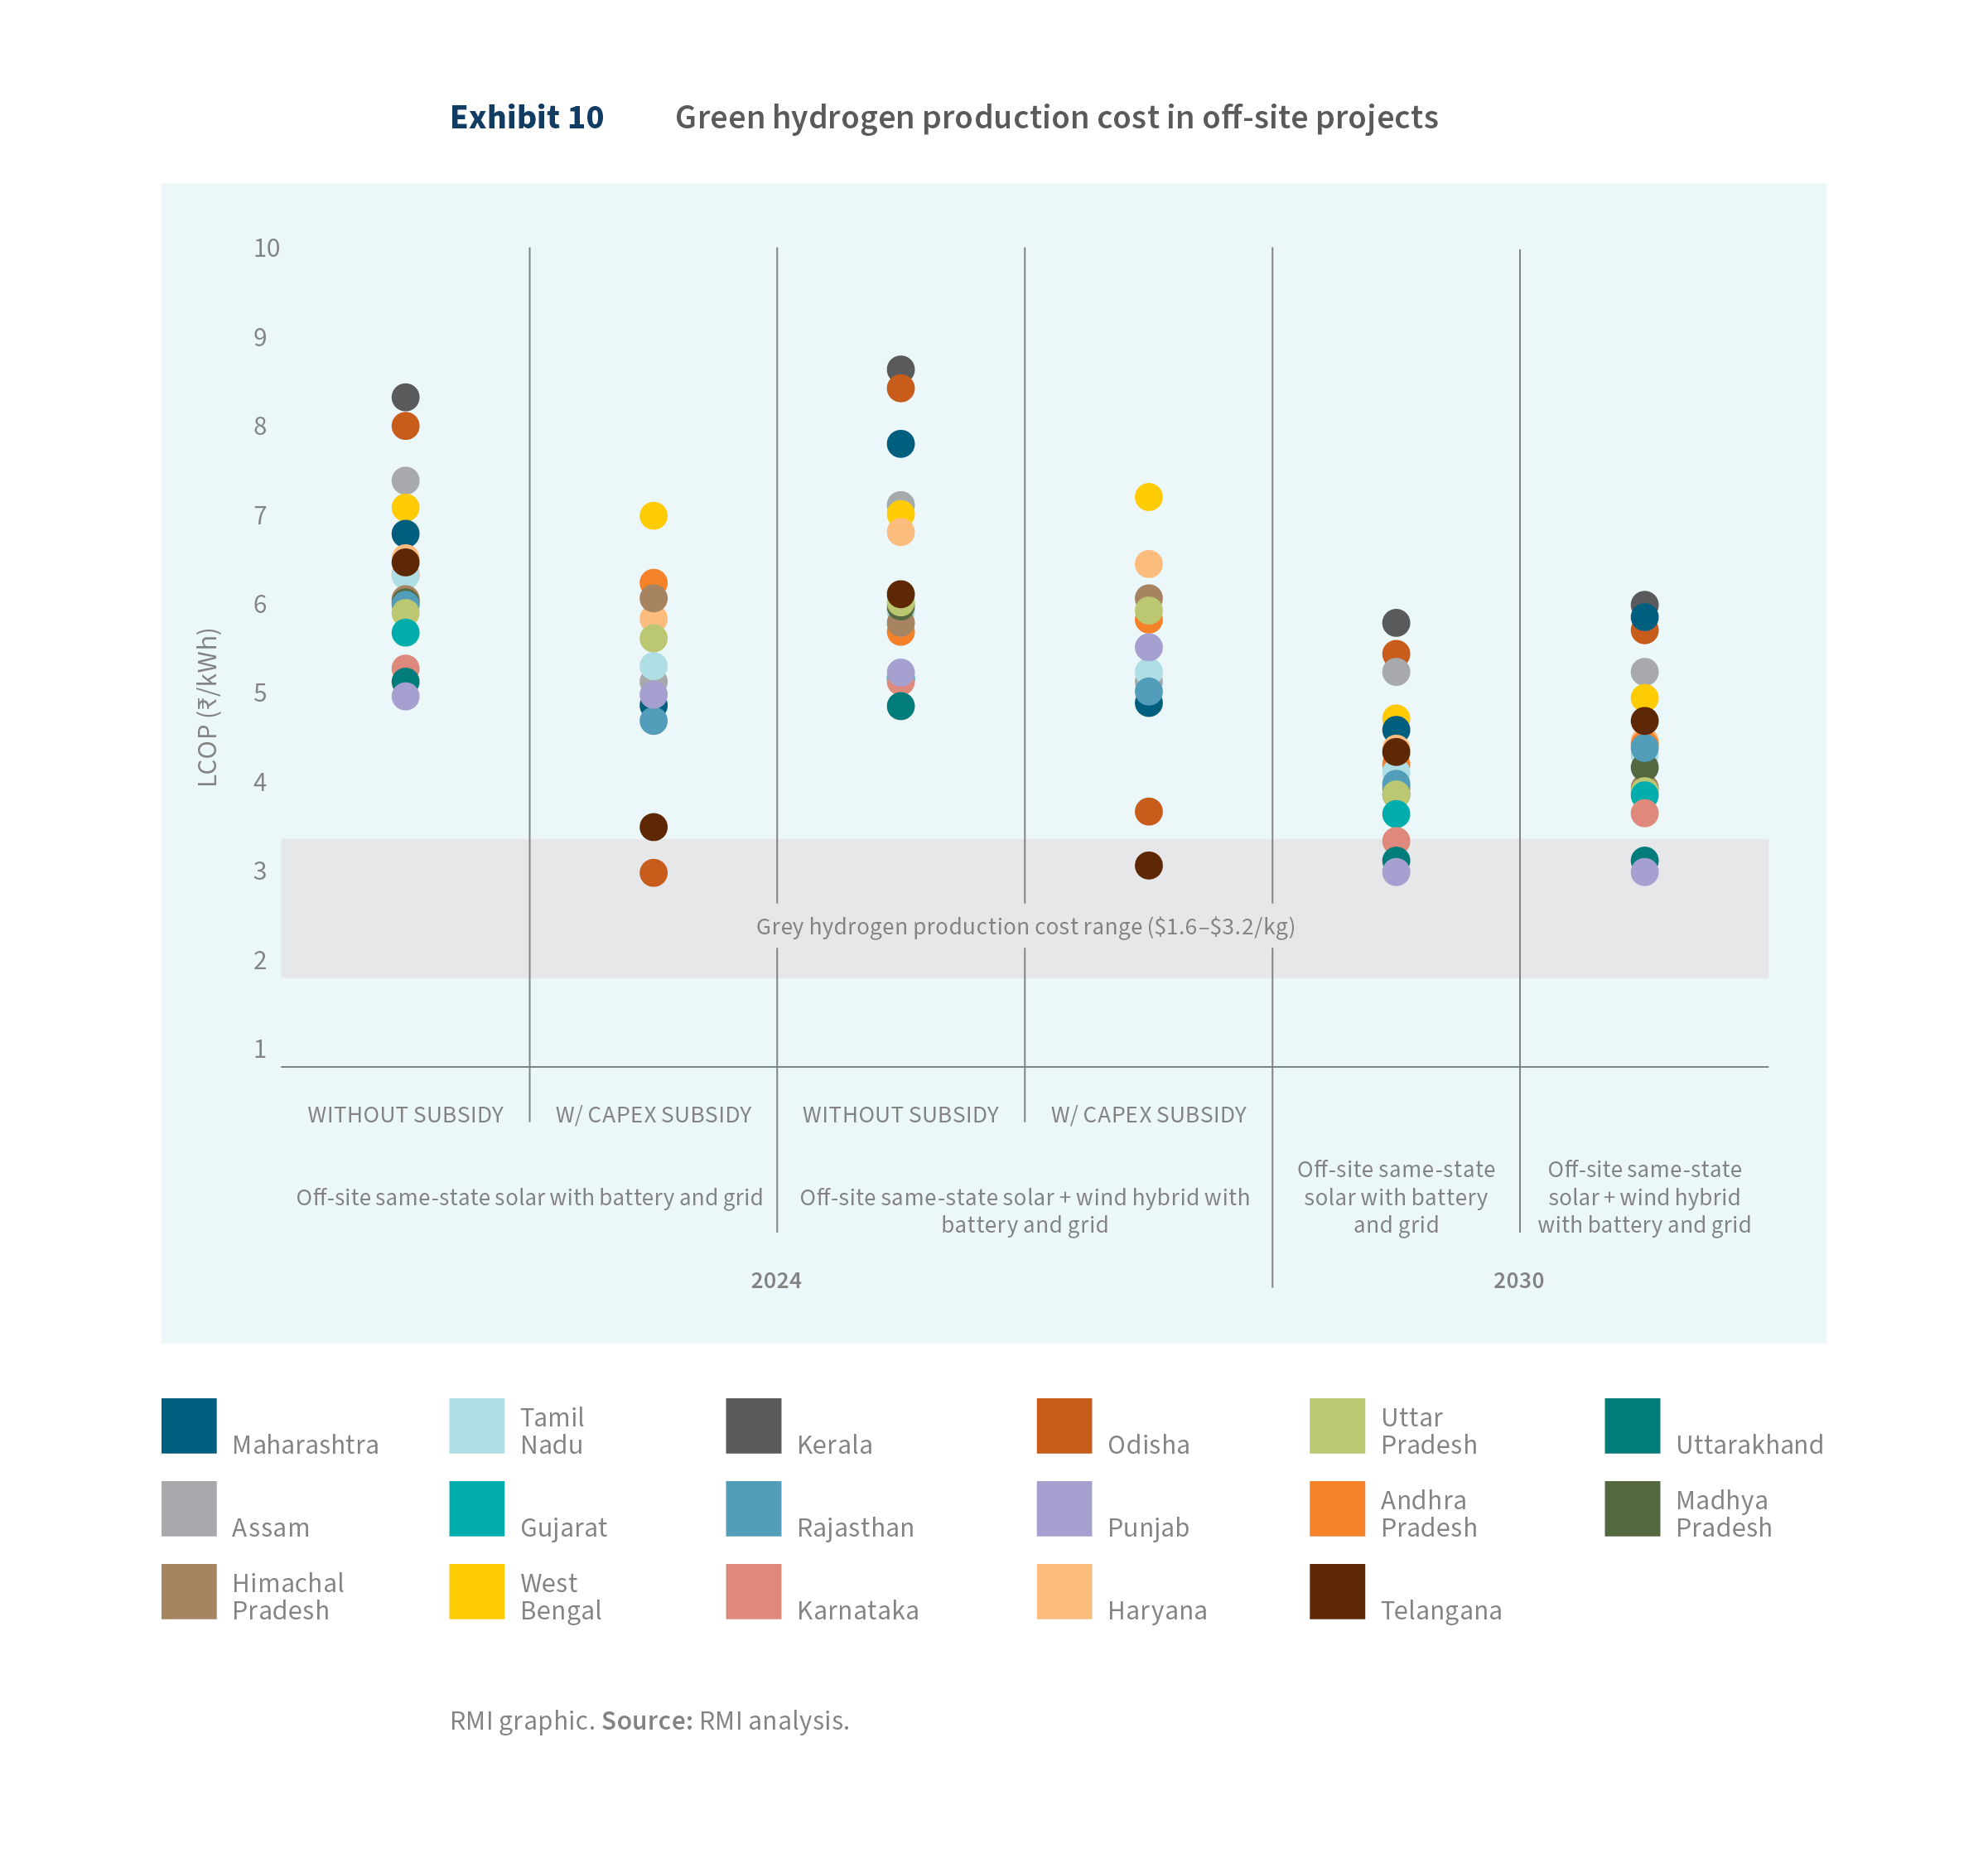
Odisha emerges as a leader in green hydrogen production cost competitiveness. As outlined in Stand-Alone On-Site Projects, the state’s comprehensive incentive package could bring down green hydrogen costs to as low as $3/kg, which is roughly 42% lower than the average production cost across other states. This positions Odisha as one of the most attractive locations for green hydrogen development, offering significant cost advantages both in the short and long term. Moreover, the scale of these incentives makes Odisha the only state capable of achieving green hydrogen prices that could currently compete with the cost of grey hydrogen, further enhancing its appeal for investment in the sector.
Long-term economies of scale are expected to play a crucial role in enhancing the overall competitiveness of green hydrogen production across states. As projects scale up, production costs will decrease due to more efficient use of resources, better technology, and lower unit costs. Currently, the average cost of green hydrogen production across 17 states is around $4/kg, without factoring in state-specific incentives.
By 2030, 9 of these 17 states will already be producing green hydrogen at a cost below $4/kg, with some of the most competitive prices expected in Gujarat, Uttar Pradesh, Karnataka, and Rajasthan. These states benefit from lower transmission and energy costs, making them attractive for large-scale green hydrogen production.
However, important industrial states such as Maharashtra, Odisha, and Andhra Pradesh continue to face higher production costs due to elevated transmission charges levied by the state governments. These transmission fees significantly drive up the cost of power, which is the key input for producing green hydrogen, making it harder for these states to compete on cost.
On the other hand, industrial powerhouses like Gujarat and Karnataka offer some of the most favorable cost structures. Their lower transmission fees, combined with the ability to scale production, give them a significant competitive advantage. By capitalizing on economies of scale, these states can offer some of the best cost dynamics for green hydrogen production, which will strengthen their position as leaders in the emerging green hydrogen economy.
Contracted power–based projects
In the green hydrogen sector, many players are aiming for vertical integration in the whole supply chain, from renewable energy generation to green hydrogen production. Some are also expanding into the production of hydrogen derivatives and exploring end-use applications. However, a segment of the industry is focusing exclusively on green hydrogen production, opting not to invest directly in renewable energy generation. In these cases, companies rely on sourcing renewable energy through PPAs rather than owning renewable assets.
One of the key advantages of sourcing power through a PPA is the ability to maximize the utilization of the hydrogen production plant, potentially up to 100%. This high utilization rate allows for the optimal use of electrolyzers, reducing both the capital and operational expenditures associated with them. By running at full capacity, companies can minimize the size and cost of the electrolyzer needed for hydrogen production, leading to improved efficiency in equipment use and overall project cost management.
PPAs enable companies to secure a reliable supply of renewable electricity for hydrogen production without the need to diversify into the renewable energy business. These agreements offer the advantage of stable energy access, which is critical for hydrogen production processes that require continuous power supply. However, this arrangement tends to come with a higher landed cost of electricity compared with vertically integrated models.
Based on the analysis, the landed cost of contracted power is expected to range between ₹5.3/kWh and ₹8/kWh ($0.065/kWh and $0.098/kWh), with an average of ₹6.9/kWh ($0.084/kWh) across 17 states. Since the base contract cost remains constant, the variation in landed cost arises from the differing charges applicable in each state. Compared with other scenarios across the states, this landed cost is 6%–140% higher.
The baseline cost of power in a third-party PPA is typically higher than the base generation cost that would be achieved through direct ownership or captive power generation. This is due to the added expenses from transmission and distribution charges, including cross-subsidy surcharges and additional surcharges. These fees, often applied in third-party agreements, are typically waived in captive or group captive projects, where companies generate and use their own power or share resources among a consortium. As a result, the reliance on third-party power procurement adds to the operational expenses of hydrogen production.
Consequently, the cost of hydrogen production shows significant variation, ranging from $5.9/kg to $8.5/kg, which is considerably larger than in other scenarios. Although state policies help reduce costs, most waivers are applicable for only a limited time and do not span the entire project life cycle, limiting their impact. According to the analysis, the anticipated cost reduction could be around 10%. However, it is important to note that these contracts are typically not for project life, and subsequent negotiation may help secure lower prices as market dynamics evolve.
Despite the benefits of high utilization, the significantly higher landed cost of electricity in third-party PPA arrangements outweighs the gains. The elevated electricity costs result in a higher overall cost of hydrogen production compared with other project configurations, such as vertically integrated models or captive power setups. This raises important considerations for investors about the trade-off between maximizing production efficiency (by fully utilizing electrolyzer capacity) and minimizing overall costs through more strategic project structuring.
This scenario also prompts broader questions about the most effective investment strategy for green hydrogen projects. Should the industry prioritize maximum utilization of production assets, or should it focus on optimizing the project structure to balance power costs and operational efficiency? These questions are crucial for determining the long-term sustainability and profitability of green hydrogen ventures and are explored in further detail in the next section.


